While I was working on a Power BI model, the time it took to refresh increased drastically. I’ve been working on loading historical records into a Power BI model as a Type 2 Slowly Changing Dimension. In this post I talk about why using the special null replacements commonly used in Type 2 Slowly Changing Dimensions can be a hazard with default Power BI settings.
Type 2 Slowly Changing Dimensions
If you’re not familiar with the term Type 2 Slowly Changing Dimension, it’s a modelling technique used to record copies of data as it has changed over time. In a type 2 SCD, when a change is made in the original data source, it is not updated in the copy. Instead, two additional columns are added to the copy, a “start date” and “end date” for that version of the row. When an update is made, the latest existing row is flagged as “No longer active” by setting the finish date, and a new row is added with the current date as the start date, indicating the new state of the data.This lets us identify what was the data in the row at a certain time, and when changes were made.
Because we often want to be able to filter against both the start and end dates, for example “which customers currently live in Southland”, we don’t want a null start date or end date.
In SQL Server, I use 31st December, 9999 as the latest row’s finish date, and 1st January, 1900 as the earliest row’s start date. This means I can filter for versions of the rows that were active at a certain date and/or time.
Implementing a Type 2 Slowly Changing Dimension in Power BI
I didn’t think much of a PowerQuery step to replace null start and end date times with 01/01/1900 and 31/12/9999 respectively.I later found the refresh time for my Power BI model felt unacceptably long on my development workstation. It’s a big model, and I put it down to recently added tables.
I’m starting to get to grips with DAX Studio, so I used the View Metrics feature of the application to see whether there were any columns in my model I could trim down in precision or distinct values, but was surprised to note the local date tables, starting with “LocalDateTable_”, consumed most of the model size, and the number of unique values in two of them were huge - the start and end dates of the type 2 SCD table.
DAX Studio told me the minimum value for the Date column of the local date table was 01/01/1900, and the maximum was 31/12/9999, and it had a very large number of rows.
An example
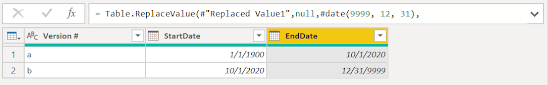
- Create a table like below.
- Use ReplaceValues to replace the nulls with the minimum / maximum dates
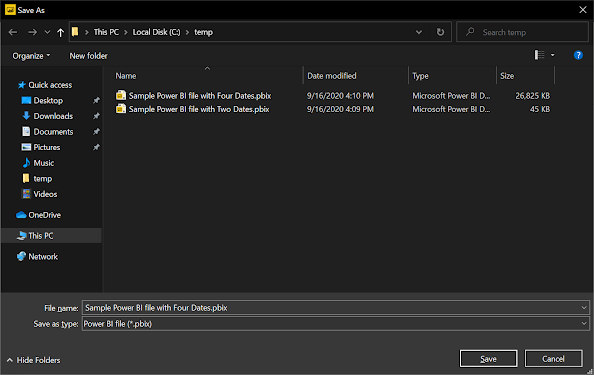
- Select Save and Apply.

Note that before the above replace values step is added, the data file is tiny (45KB). After, it is much larger (26MB).
Whenever we have a date or datetime column in Power BI, and have the "Auto Date/Time" feature turned on, Power BI creates a separate hidden table of dates for each date column. This is so date time intelligence, and graphs that show dates, function properly.
In my screenshot above, the range of values (with the replaced nulls with special values) are from 01/01/1900 - 10/01/2020 in one column, and 10/01/2020 - 12/31/9999 in the second. In response, it created two date tables, one with 44,195 rows, and another with 2,914,635 rows, each holding the number of days in the respective years.
I used the below query to get these figures.
I used the below query to get these figures.
EVALUATE SUMMARIZE('LocalDateTable_5f4576c5-f0ec-4966-8499-2c0f7a8b3505',
"Rows", COUNT('LocalDateTable_5f4576c5-f0ec-4966-8499-2c0f7a8b3505'[Date]),
"Min Date", MIN('LocalDateTable_5f4576c5-f0ec-4966-8499-2c0f7a8b3505'[Date]),
"Max Date", MAX('LocalDateTable_5f4576c5-f0ec-4966-8499-2c0f7a8b3505'[Date])
)
The two local date tables held 196.94806MB of data, according to the “Col Size” column in View Metrics (Vertipaq Analyser) feature in DAX Studio.
Here's the before shot,

Here's the after shot.

One question that I do still have, I can't see why my table's “Version #” column is so large in the first screenshot, but so much smaller in the second - the "StartDate" and "EndDate" columns from the same table don't have that behavior. In both the before and after, this column holds only the two rows, values “a” and “b”.
With the large local date tables, the loading time of this basic dataset also went up from 3 to 9 seconds with the additional couple of millions of rows in those local date tables.
Interpretation
Okay, I’ve heard that large data models should have a custom date table, but I’ve never seen a reason why. Here it was made very clear to me - using a local date table for a large range of values will slow down my reports. I expect adding a lot of date columns will too.Response
In response to the above, I’ve added a custom date table, marked it as the date table, and set up relationships to it from my date columns. I’m also becoming more fluent in DAX, so feel more comfortable using a role-playing (single) date table, and using deactivated relationships in my DAX expressions to use the right relationships when querying.I’m going to still keep using LocalDateTables when I’m working with a simple dataset without large ranges of dates.
No comments:
Post a Comment